Cookies and the protection of your data

We use cookies to improve the functionality of the website, to offer you a better website experience and to provide social media features. You give your consent by clicking on “Accept all Cookies” or as part of your individual settings. Please find detailed information on the use of cookies on this website in our Data Privacy Statement.

Functional Cookies

These cookies are necessary for the operation of the site and enable security-relevant functions. In addition, we determine whether you want to remain logged in and to make our services available to you when you change between this and other websites.

Statistical Cookies

These cookies are used for analyzing user behavior on our website with the aim of improving user navigation. All data collected is evaluated anonymously. Further information is available on our data protection site.

Marketing Cookies

These cookies are used to deliver relevant advertising or to limit how many times you see an ad. Marketing cookies can share that information with the advertiser (third-party cookies). The legal basis for the data processing is the consent of the user.

Advanced Data Visualization
2024

Share:

Advanced Data Visualization

Design System

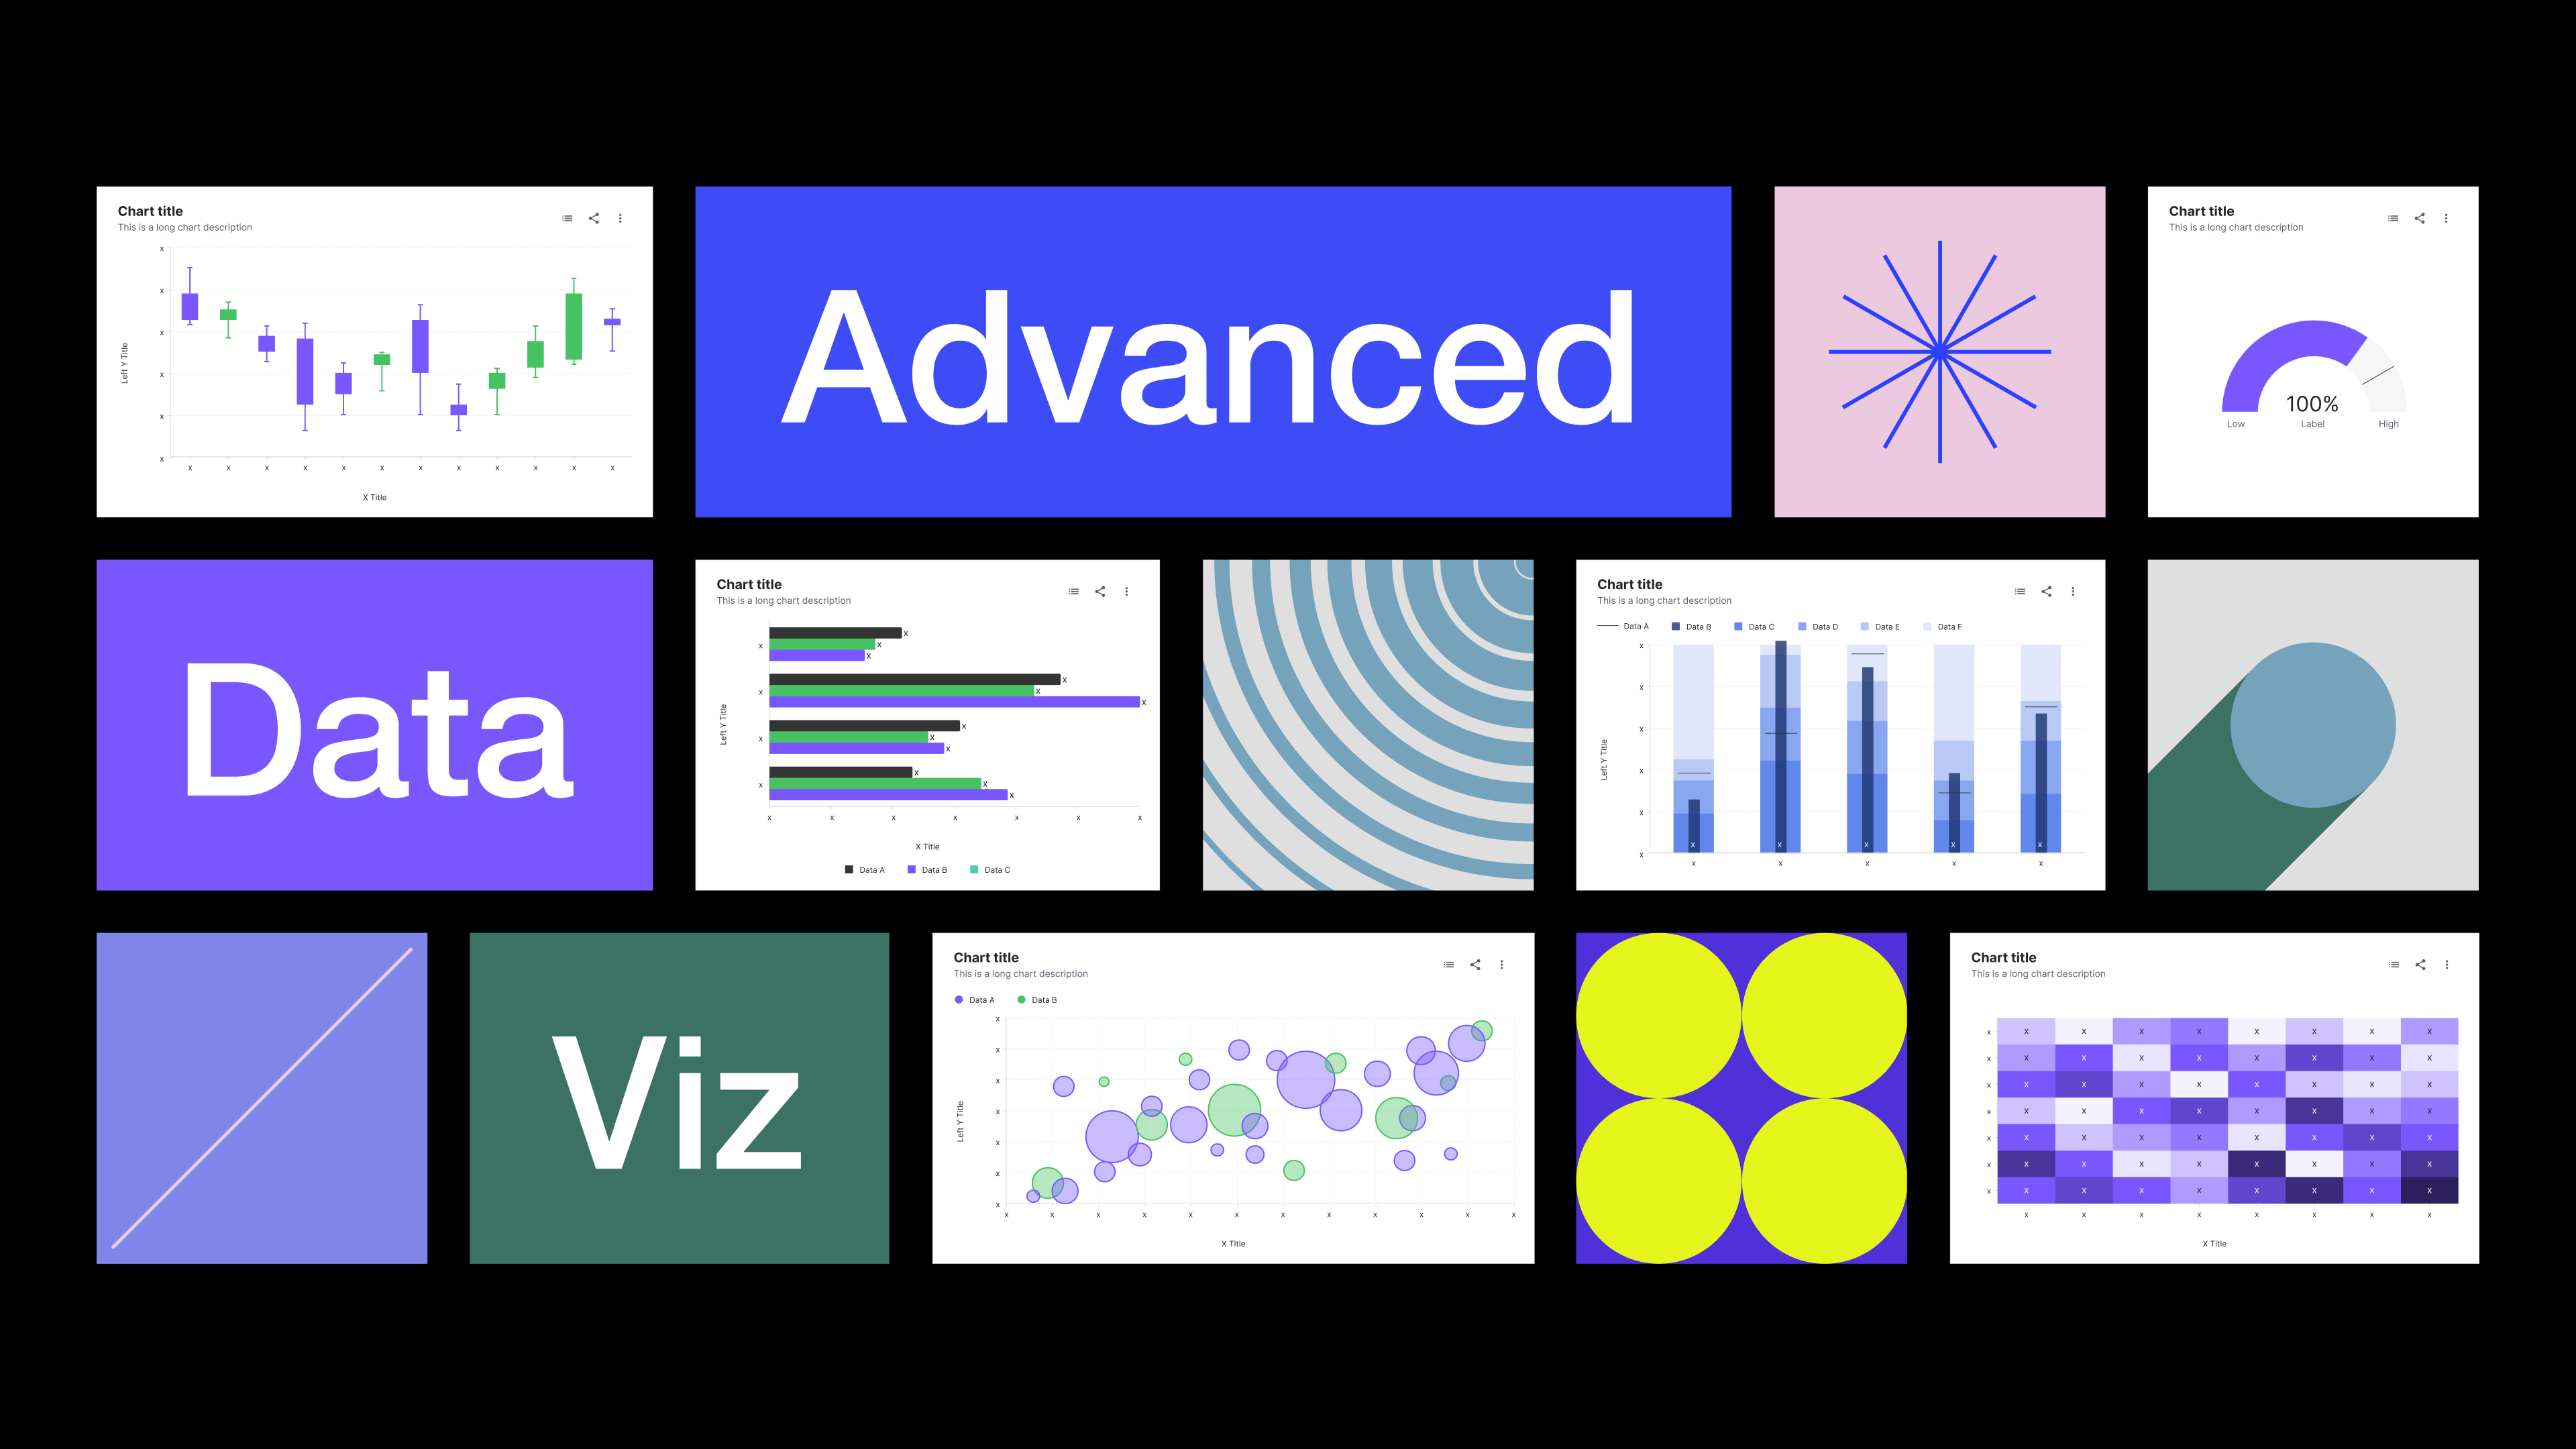
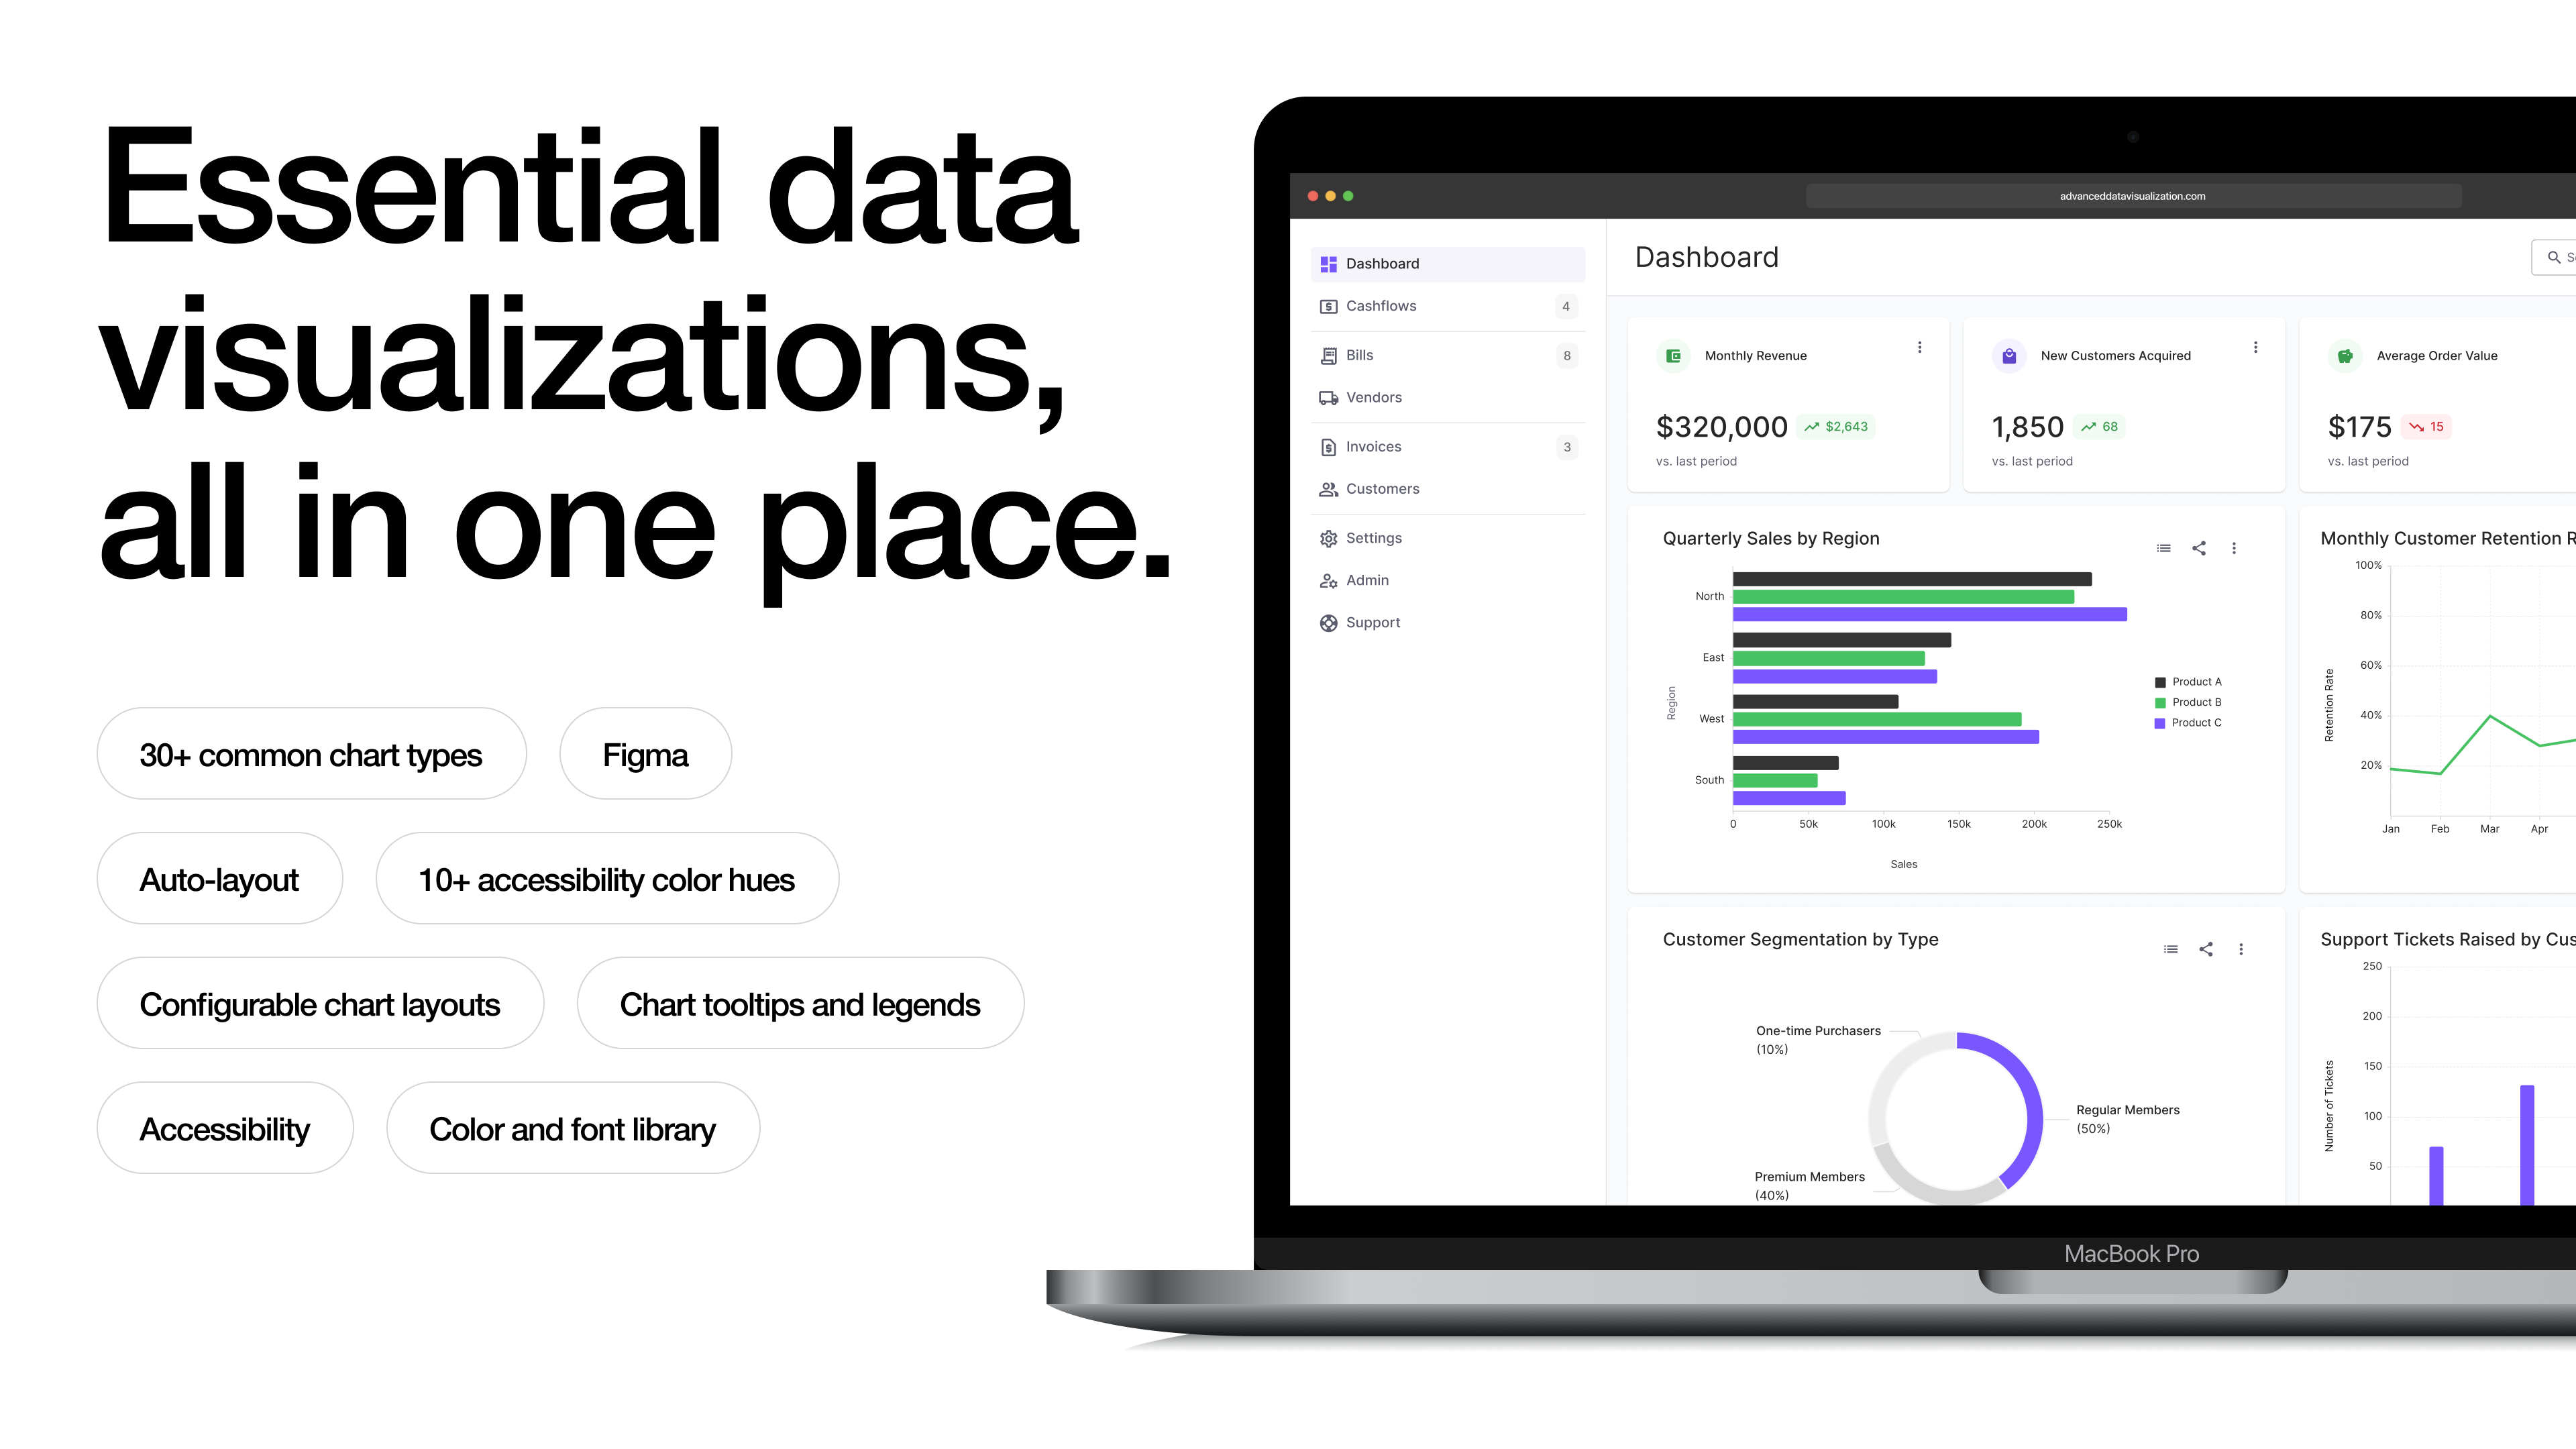
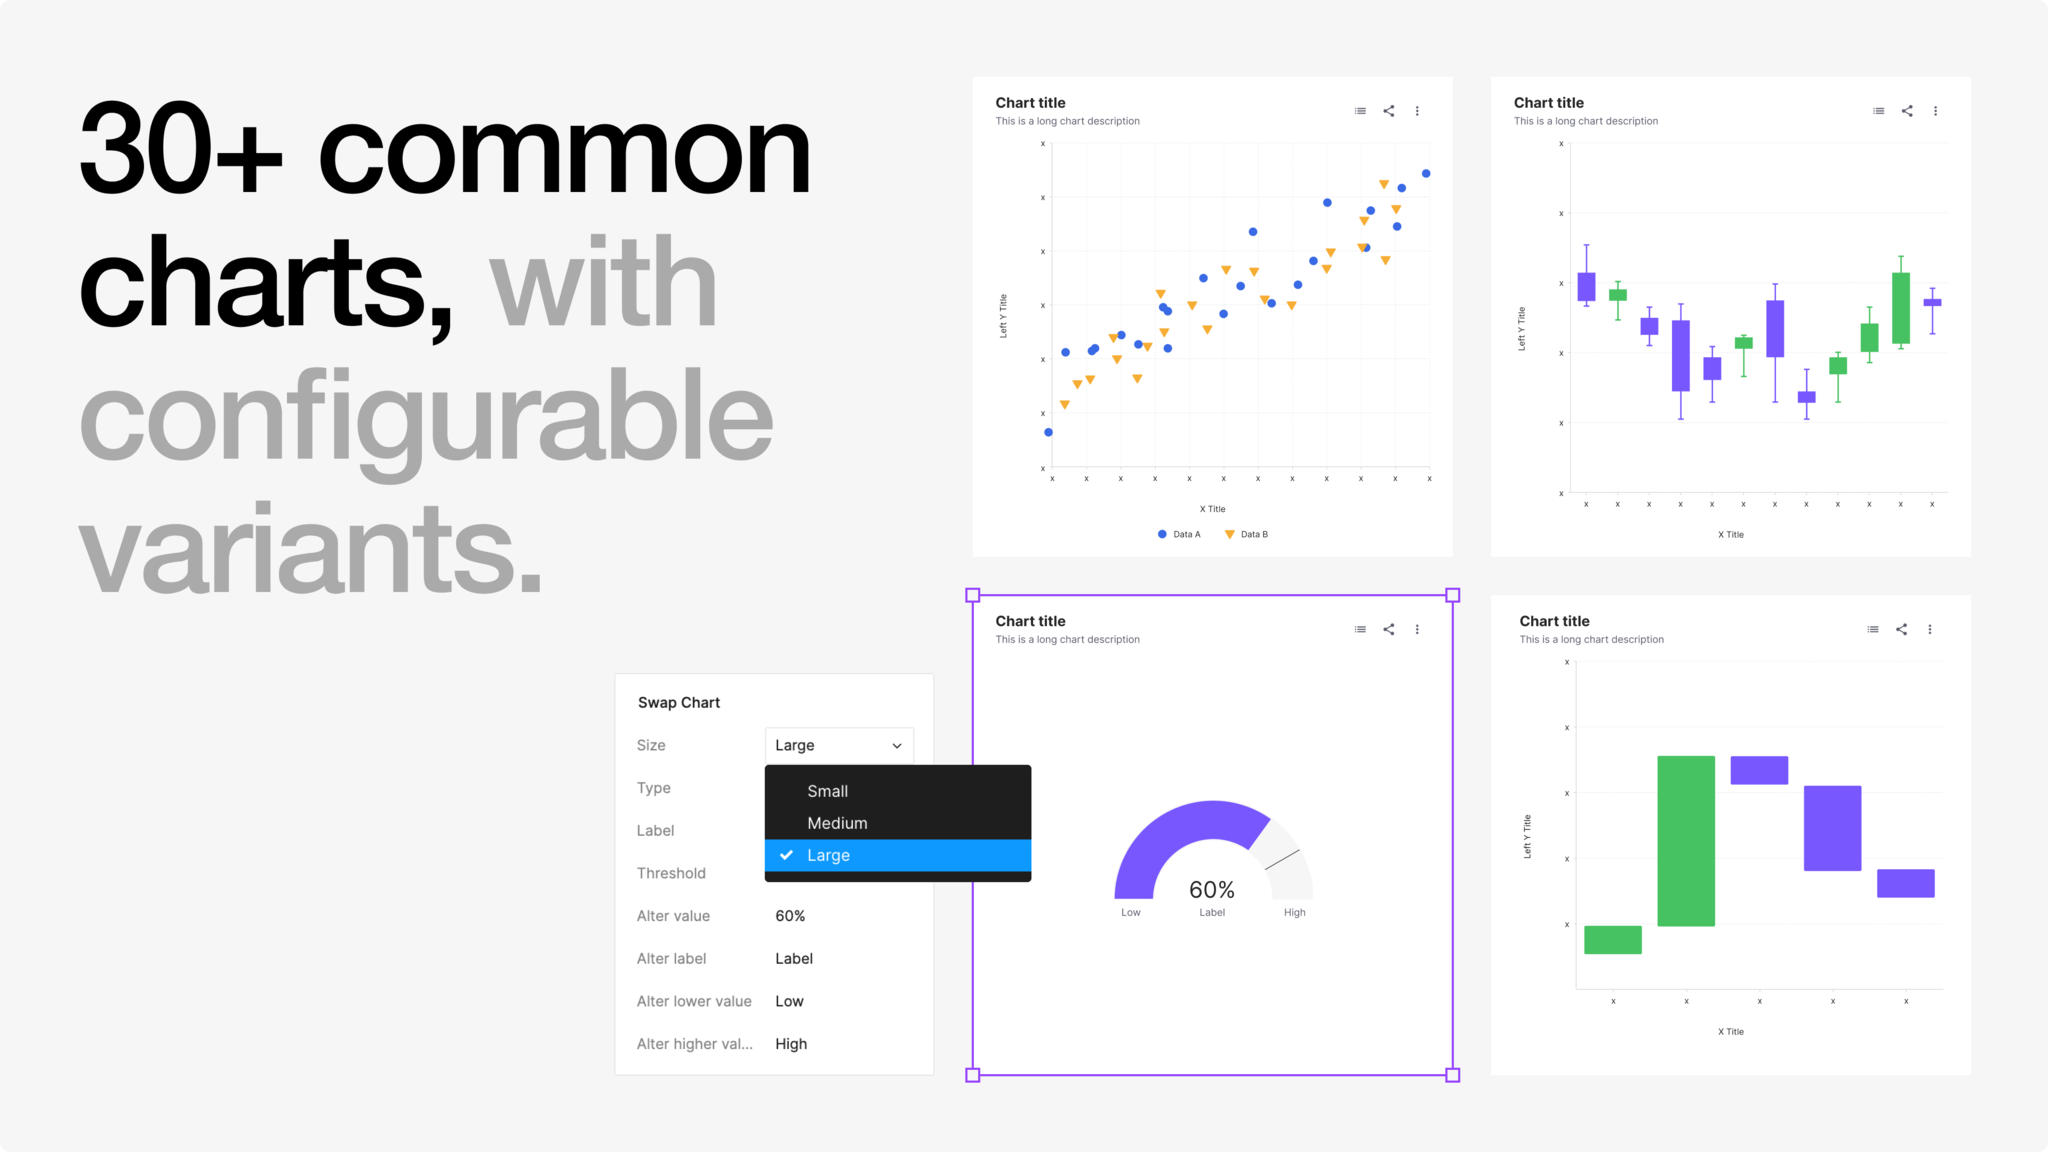
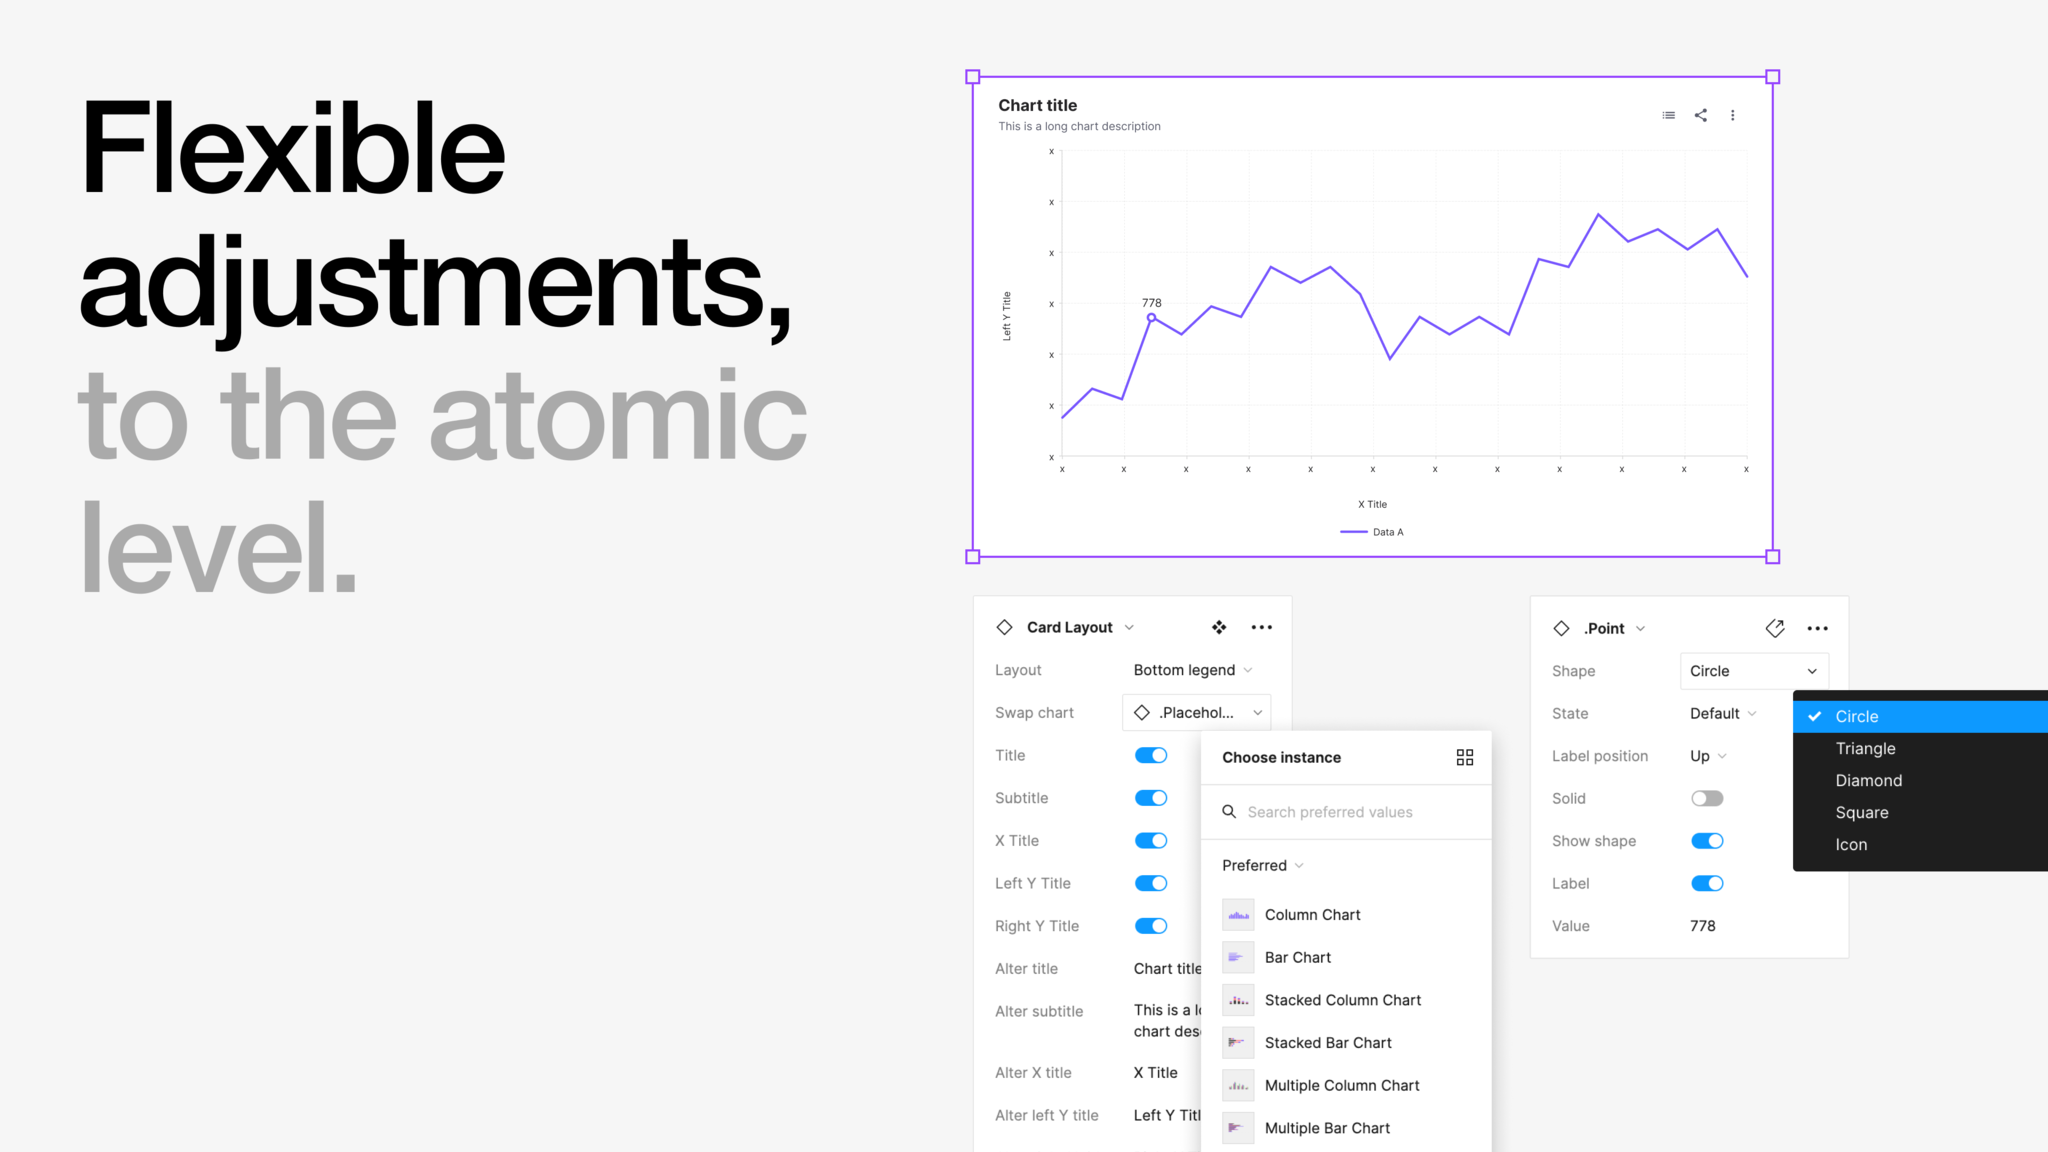
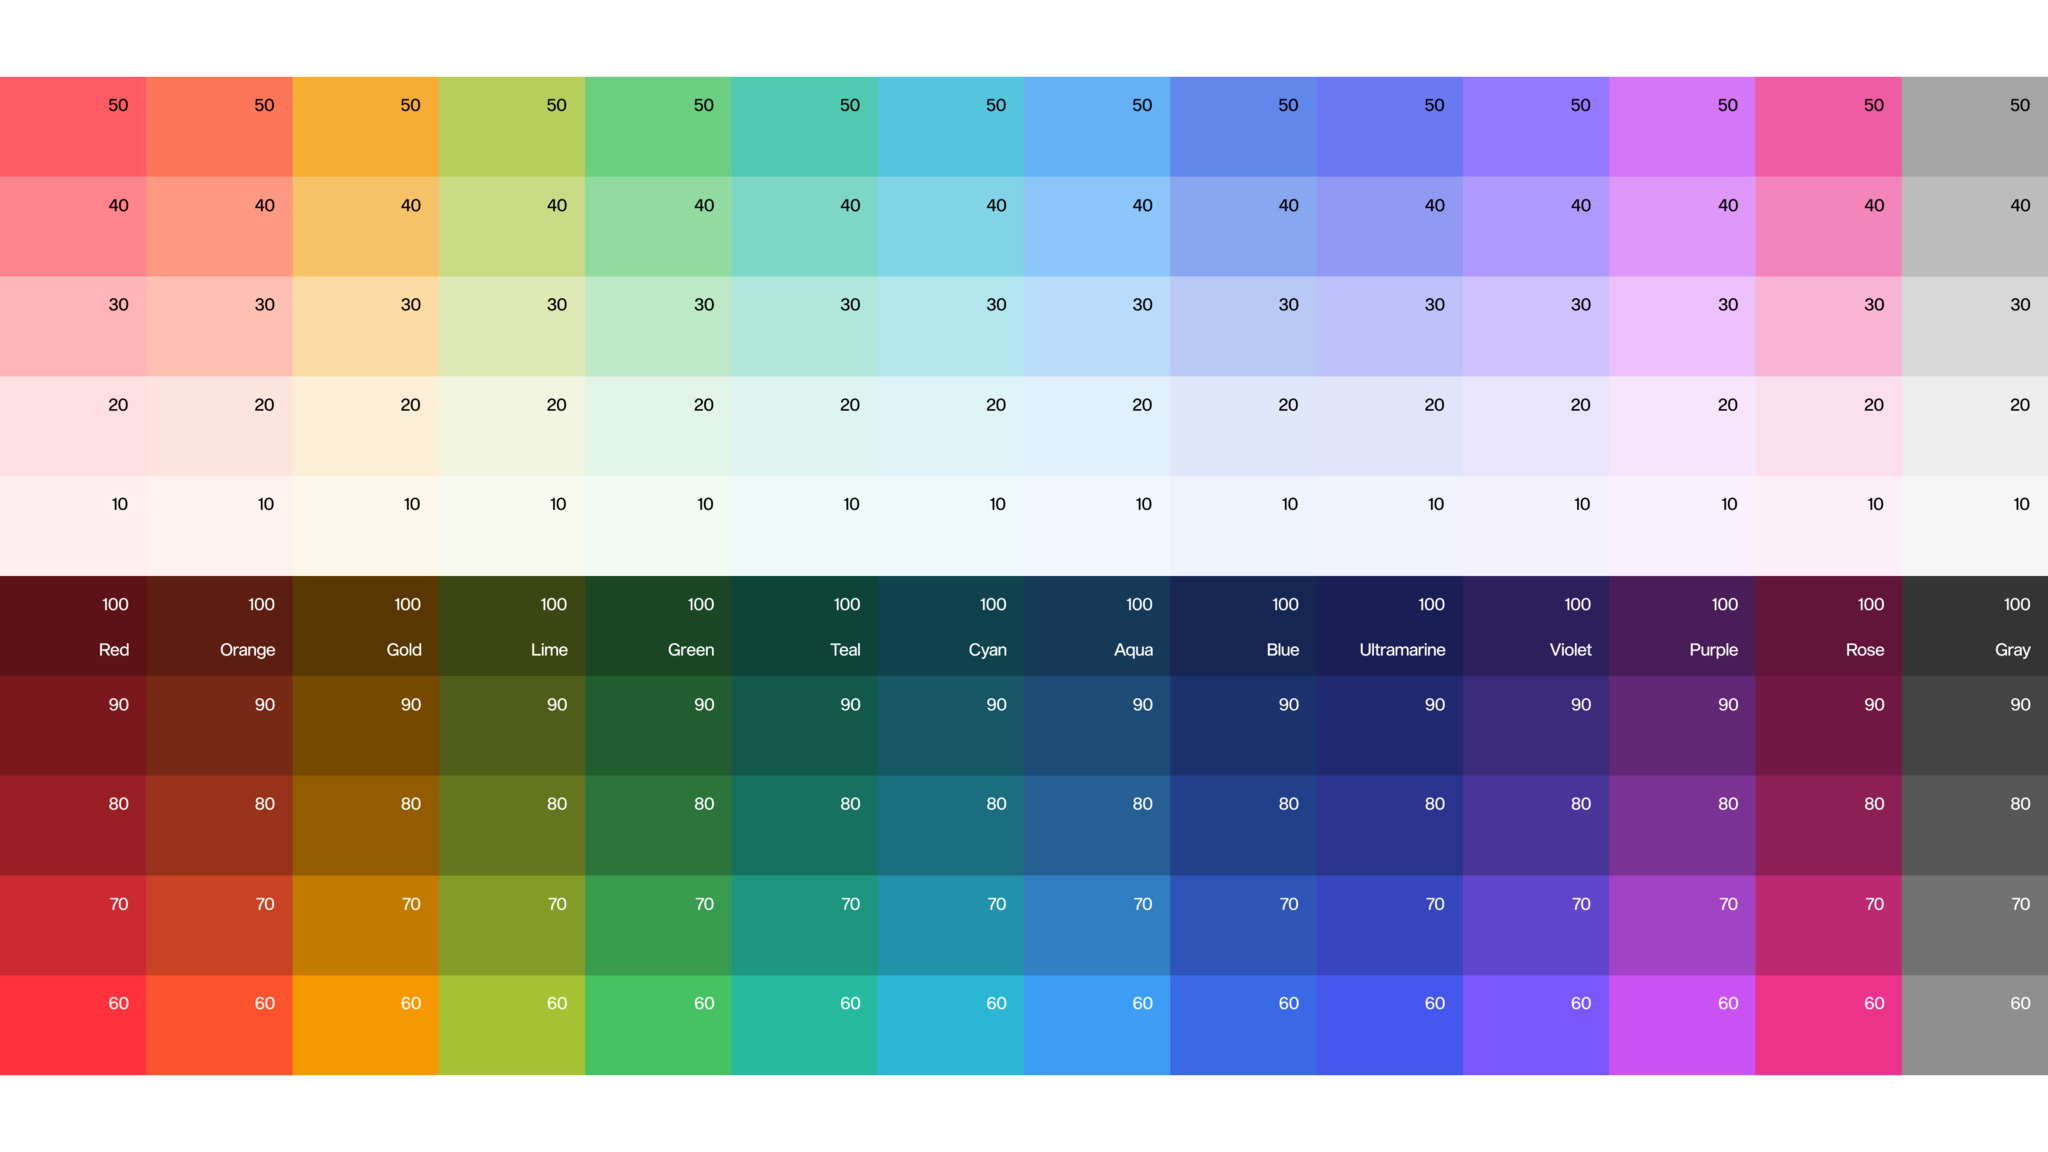
Advanced Data Visualization offers a high-quality chart library, ideal for crafting charts, infographics, and prototypes. It’s a unique design system addressing the pain points in the niche area of the data-heavy design. Designers can swiftly assemble dashboards in minutes, bypassing groundwork, with its extensive range of chart types. Featuring adaptive color palettes and flexible elements, it seamlessly combines design consistency with ease of use. This tool effortlessly translates raw data into clear and intuitive visuals, helping designers decode complex information into easy-to-understand narratives with higher delivery efficiency.

Client / Manufacturer

Figma Community

San Francisco, California, US
Design

Mingzhi Cai

Jersey City, New Jersey, USMingzhi Cai
Date of Launch
2023
Development Time
Confidential
Target Regions
Africa, Asia, Australia / Oceania, Europe, North America, South America
Target Groups
Consumers / Users, "Designers and developers"

RELATED PROJECTS