Digitale Akustische Kartographie
Digital information graphic (application)
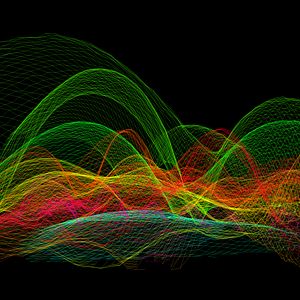
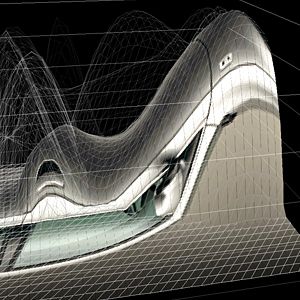
Today there are various sophisticated methods to locate sound, but known visualizations still strongly remind of thermographic images. Acoustic shapes, unlike thermographic ones, differ from the contour of the measured object. Image overlays make it even more difficult to read and compare the results. The diploma thesis Digital Acoustic Cartography is an interactive experiment in mapping sonic events into a concrete visual language. Source material for the visualizations are image sequences recorded by the acoustic camera, developed by GFaI, Berlin. Both, acoustic and photographic images are analyzed by processing. The color spectrum of the acoustic images is used as distortion matrix to warp the original picture into a three-dimensional relief. The color code is replaced by the photographic data.